Posts Tagged ‘visual studio’
July 7th, 2017
I seldom use F5 (start the application in debugging mode in Visual studio) but instead run it normally and connect the debugger only when I need to.
Connecting the debugger takes a measurable amount of time so with a faster turnaround I can keep focused better.
I also leave IIS running all the time. It does shadow copying so there is no need to restart anything.
I have recently switched from IIS to IIS express while developing and hence need to have it running all the time. That I do through the command prompt with
1
| "c:\Program Files\IIS Express\iisexpress.exe" /path:C:\PathToMyWeb /port:32767 |
where path is the path to the site (where the web.config resides) and the port is what you see in the web project properties or in the web browers’s address bar the first time you hit F5.
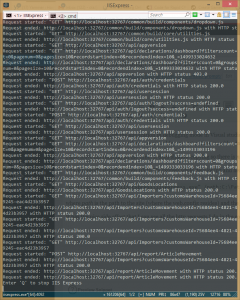
It has the nice side effect that I can see all the http requests I do in the command window, a light weight current log of sorts.
August 30th, 2016
There are some I use that might be useful for my readers too:
Resharper has 3 main combinations.
shift-alt-enter – Somewhat resembles Visual studio’s ctrl-..
ctrl-shift-r – Refactoring. Resharper’s raison d’être.
alt-ins – Inserting stuff by templates. E.g. a constructor taking all properties as arguments or Equal and GetHashCode methods.
ctrl-alt-q – Quickview instead of shift-f9
ctrl-w – Mark whatever you’re at. It can be set to recognise Pascal/camel cased words too as one often wants to edit just a part of a variable name.
Here’s a nice touch: continue press ctrl-w and the mark extends. A super way to mark a method.
ctrl-f12 – Go to implementation (instead of declaration). Often ctrl-f12 is enough.
alt-f12 – Sneak peak of whatever you are standing on. A good way to look at a called method body without having to open yet a window, or move in an existing.
Here’s a nice touch: the opened sneak peak is a full fledged editor so go ahead and navigate, edit, debug and edit-and-continue as you are used to.
Above the method name (VS2015) there is a row with information about callers, editors, tests and whatnot. Hover over them with the mouse pointer and you get the shortcuts. They are typically ctrl-alt-1, ctrl-alt-2 und so weiter.
ctrl– and ctrl-+ – Navigate back and forward in history. On pre VS2015 this did not necessarily work with a non-us keyboard layout.
ctr-esc – Close the active tool window.
ctrl-shift-f12 – Go to the next item in a list, typically compile error but some other lists work too. Try compile with some errors. Then you can step through the errors with this shortcut.
TODO:Check it really is shift-alt-f12 as my muscle memory seems to elude me.
ctrl-shift-l – Delete current row. This is not as good as can be. Ctrl-l should be shorter but it is bound to cutting the row. Unnecessary really since ctrl-x does this if nothing is marked. I have earlier bound deleting a row to ctrl-l but nowadays don’t bother; i press ctrl-shift instead.
ctrl-x and ctrl-c – When nothing is marked they cut respectively copy the current row.
ctrl-shift-v – Cycle through Visual studio’s multi clipboard. A multi clipboard is a must. I use Ditto instead so I get a system wide multi clipboard with search capability and power off persistance.
shift-alt-enter – Maximises the window even more. There is no need for the top bar which says “Your project name – Microsoft Visual studio” and takes up the whole top of the screen. In the VB6 IDE one could even get rid of the menu; it is seldom needed to be visible – one just pressed alt or moved the mouse to the top and it showed again.
ctrl-r-t – Run the test method the caret is positioned in. If the caret is outside of a method is runs the whole class. If it is outside the class… – I haven’t checked, you tell me. Both Visual studio and resharper lacks some basic functionality like debug last method; as it stands now there is only run last method. I have the need to switch back and forth between running and debugging. If you are deep into writing tests – check Ncrunch which does a fantastic job of running tests and visualising what is tested and what is not. It also has the handy tool run any test that brings me to where the caret presently is. (r#)
ctrl-r-ctrl-t – Debug the test method… see ctrl-r-t. (r#)
One can have two windows side by side. Tests on the left and testee on the right. Or HTML on the left and Javascript on the right. Or client code on the left and server code on the right. One can have three windows side by side. Four.
April 7th, 2016
I don’t think the standard type in Visual studio is the best one just because it is what is shipped.
Instead I test different and from 10+ years I have come to the conclusions:
1) Sans serif is better than serif.
2) Fixed width is not important – it is very seldom I need anything aligned by the count of characters. When I do I change and then change back.
3) Proportional width packs more characters per cm without losing readability.
Of all the fonts I have tested I still believe Arial is the best compromise.
Its drawbacks are that parenthesises are to narrow and that exclamation mark is too narrow and hard to read. I write mainly C# and Javascript and then ! is very important.
When I started out I believed that capital letter O looking similar to digit 0 would be a problem but have come to the conclusion that in reality it is not.
Fonts tested: (I have tested way more but just recently decided to write them down and cannot remember all)
Arial // yes
Arial narrow // Too dense to be readable on screen; for me at least.
Bahnschrift light // The colon and semi colon are too light. Almost invisible at my setting.
Calibri
Comics // Did not work for programming – too hard to read.
Consolas // Nope, too stiff.
Courier // Serif, does not work, too slow to read.
Kalinga
Leelawade UI // Works alright.
Malgun Gothic // A bit to wide for my taste. Also a bit “squarish”.
Microsoft new Tai Lue // Nice. A tad to wide for my taste.
Microsoft MHei // Lighter than Microsoft new Tai Lue. Maybe too light. About as wide.
Microsoft JhengHei UI Light // Too wide for my taste. Reading was not fluent. One/L/Pipe differs. O/Zero differs. Discreet parenthesis. Thin !.
Microsoft YaHei // Could be more narrow. Easy to read.
Nirmala UI Semilight // Pixly.
Segoe UI // Nice. One/L/Pipe differs. O/Zero differs. Discreet parenthesis. Normal !.
Tahoma // Possibly too fat. One/L differs. Pipe only small difference. O/Zero differs. Normal parenthesis and !.
Yo Gothic // Works alright but is a wee thin on the laptop but ok on my bigger monitors.
Yo Gothic Medium // Slightly fatter than Yo Gothic. Ok. Different O0 and 1l but discreet !.
Yo Gothic UI // What I am currently testing.
June 5th, 2014
Abstract
The only way to edit architecture and modelling with Visual studio is to buy the very expensive Ultimate edition. This means that it will be not everyone can be involved in the process of evolving the solution.
TL;DR
Development requires Architecting an Architecture in some way or another. This architecture is not written in stone but changes as time or business changes; we call it requirements change.
In the old days, like 20 years ago, I learned that there is an architecture phase and then a development phase. This is not considered best practice any more. Also not best practice is to have silos with Architectures and Testers and Coders and Database managers.
This is where Microsoft and Visual studio fails. Not technically but license wise.
Look at this part of a comparison chart for different Visual studio versions. It clearly explains that Architects must have the Ultimate edition and that no one but Architects are allowed to change any Architect document. (the Ultimate edition is way more expensive than the others)

Visual studio comparison fail where it shows that only Ultimate can edit architecture stuff. Original from Wikipedia.
May 9th, 2014
I have earlier, here and here, written about how to write a macro to attach the debugger to a running process as it is often faster than starting the process anew.
Lately the Visual studio plugin ReAttach has come on my radar and I have tried it with success. It remembers the last attaches you did and keeps them in a menu. Fewer key strokes and fast attaching is the result.
March 2nd, 2013
Visual studio contains snippets. These are “shortcuts” for writing various code. Try writing for in the editor and text is typed in for you and you get placeholders for faster code writing.
One can write code like this oneself. It is quite easy. Just go to menu->Tools->Code snippets manager and work from there; copy, paste and rewrite to your will. (The location field is the folder of the very snippets.)
Here is an example of mine.
I know that some people swear that #region is the devil’s own child but there are other, let’s call us them for pragmatists for now that say that if it fits it fits. The standard snippet outcome for a region is
1
2
3
4
5
| #region // Name of region.
//code
//code
//code
#endregion |
but I prefer
1
2
3
4
5
| #region // Name of region.
//code
//code
//code
#endregion // Name of region. |
So I just copypasted the existing snippet to this; which you can import through above mentioned menu.<?xml version=”1.0″ encoding=”utf-8″ ?>
<CodeSnippets xmlns=”http://schemas.microsoft.com/VisualStudio/2005/CodeSnippet”>
<CodeSnippet Format=”1.0.0″>
<Header>
<Title>#region</Title>
<Shortcut>region</Shortcut>
<Description>Code snippet for #region</Description>
<Author>Microsoft Corporation</Author>
<SnippetTypes>
<SnippetType>Expansion</SnippetType>
<SnippetType>SurroundsWith</SnippetType>
</SnippetTypes>
</Header>
<Snippet>
<Declarations>
<Literal>
<ID>name</ID>
<ToolTip>Region name</ToolTip>
<Default>MyRegion</Default>
</Literal>
</Declarations>
<Code Language=”csharp”><![CDATA[#region $name$
$selected$ $end$
#endregion // $name$]]>
</Code>
</Snippet>
</CodeSnippet>
</CodeSnippets>
February 27th, 2013
Short story: http://msdn.microsoft.com/en-us/library/ms182470.aspx
I still miss a shortcut for “Debug the last unit test”. There is “Repeat the last run” but that runs and doesn’t debug. Strange since that is what I during times use the most. I have resorted to marking the test and the alt-s-d-enter.
Also: Resharper interferes with the shortcuts but that is more a facet of life I think.
October 2nd, 2011
There is no problem versioning a project – just edit the AssemblyInfo.cs file. But how does one update all assemblies in a solution without having to update this file for every project?
Create a AssemblyInfo.shared.cs file in any project and fill it with the versioning parts. Then link this file from all the other projects through the dropdown by the add button in the add existing file dialogue. One cannot create a file directly in the Properties folder so add it in the root of the project and then move it to the Properties folder through drag and drop.
As of VS2013 one can copy-paste the linked file and it is pasted as linked. This makes it very fast to insert a linked file in several projects in the same solution.
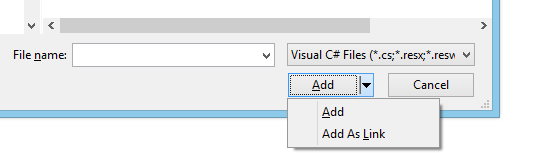
Semi hidden Add as link.
VB.Net requires a trick
The trick to do it is VB.Net (as of Visual studio 2012) is to update the vbproj file to something like
1
2
3
| <Compile Include="..\MyOtherProject\My Project\AssemblyInfo.shared.vb">
<Link>My Project\AssemblyInfo.shared.vb</Link>
</Compile> |
Above Include… is where the file is linked from and Link… is where it shows up in the target project.
Presumably the easiest way to do it is to use the shared file in the root of a project and then link it through editing the project. There is no way to directly link a file into My Project folder but one has to first link it to some other place in the target project and them move it through this hack.
(sorry for the > and < but it’s late and I really want to get the stuff into production, not update a blog)
Dynamic data
I found a trick at Stack overflow that uses T4 to enter dynamic data.
Constant reference
It is also possible to reference a constant.
<Assembly: AssemblyVersion(Common.Constants.Version)>
<Assembly: AssemblyFileVersion(Common.Constants.Version)>
and in a common file:
public const string Version = “7.1.3.*”;
I believe the value has to be a constant and not a readonly. This might (I have not bothered to check) make a difference when the common DLL is compiled but not the referencing assembly as constants are copied to the referencing assembly. A remedy might be to rebuild all.
Team city
I also cannot get it to work together with Team city. Moving the version to a file with a different name makes Teamcity update AssemblyInfo.cs and then we get 2 references to the same [assembly: AssemblyVersion(“1.0.0.0”)]. Maybe this on Stackoverflow would save my day but I haven’t had the time to delve into it.
I have another solution idea and that is to set AssemblyInfo.cs as shared and then create a unique AssemblyInfo.project.cs for each project. Have not had time for this either.
Honor those who should. Or as of later here.
September 5th, 2011
I just found out that Dpack, possibly the most important gratis tool for Visual studio there is going open source. Now I wish for time to make this super product even better!
June 25th, 2011
In Visual studio 2010 I have a solution with some projects and a unit test project. Besides the usual configurations Debug and Release I also have Debug_Test. One sunny day when compiling the project …
… I got a dialogue with
Duplicate Detected Loading Add from test.dll
In attempting to load Add form test\bin\debug\test.dll, it was determined that a test with the same id name Add in test\bin\debug_test\test.dll already exists in the catalog.
If you retry, Add from test\bin\debug\test.dll will have its id replaced with a new one.
when I tried to compile my solution with Debug_Test active. (or if it was the other way around)
When I pressed Retry I got
Error loading C:\Test\bin\Debug\Test.dll: The test ‘Add’ from ‘c:\test\bin\debug\test.dll’ that is loading has the same TestId {2704e894-0db5-60e4-53Ed-61c7e6951c9f} as the test ‘Add’ already loaded from ‘c:\test\bin\debug_test\test.dll’.
in the output console.
What was happening?
Check out the emphasis (I created). There are two compile configurations that clash.
I want Debug to compile the whole solution with the debug flag set (to know that everything compiles as it should). Then I have a Debug_Test configuration that only compiles the parts of the solution that are needed for my automatic tests. In the inner machinery of Visual studio 2010 there is something that tracks test methods and it looks like it regards Add from Debug configuration and Add from Debug_Test configuration as two different tests, albeit with the same name.
In reality they are the same unit test method code.
The whys and the hows are beyond my scope but I found a work around.
Go to the other configuration (i.e. Debug) and clean the output. Then go back to the one you want to work with (i.e. Debug_Test) and continue as usual.
One could possibly have created Debug_Test without checking Create new project configurations to avoid this too. If anyone knows, please comment.